Land cover mapping is a new protocol that we are introducing this year in Forest Watch. Given the power of image processing in the field of environmental science, the numerous Forest Watch sites that are participating in different areas of New England, and the educational importance of the activity, we think that it will make a great addition to the program. Students and teachers have also expressed a great deal of enthusiasm and interest in remote sensing and Multispec in the past, so it seems like an appropriate direction to lead them.
What is Land Cover Mapping?
Land cover mapping is the assessment of different land cover types over a certain geographic extent. There are many ways of doing this. Field workers can go into the field and actually take an inventory of species and draw a map showing what species occur in what areas. This is very time consuming and expensive. Aerial photographs can be used to trace areas of certain species, or damage classes of trees. This method has been used extensively in the past. It is much more cost effective and faster than field workers, but it still has its limitations. In recent years, we have had the benefit of satellite data and computers to help us better map the extent of various land cover types. Now, we can get larger areas mapped in less time with more consistency. With the help of image processing software such as Multispec we can learn much more about what types of land cover make up the area that we live and how that land cover has changed over time.
How does it work?
When aerial photo interpreters separate land cover types, they look through a stereoscope and trace onto a clear mylar that is placed over the aerial photo. They trace around areas of similar land cover types so that when they separate the mylar from the photo, they have a sheet with many different polygons. Each polygon represents a different type of cover, which they label.
Multispec and other image processing software programs use a system that does the same type of analysis. When you open a Landsat image, you see it as a mixture of many different colors that represent different land cover types such as trees, grass, water, soil, and urban areas. If you zoom into the image, you begin to see individual pixels. In the case of the Landsat 7 multispectral images that you will be using, the pixels will each be 30 meter squares. Each of these pixels has a value that describes that 30 meter piece of the earth. When you do a classification, Multispec analyzes each of these pixels and groups pixels together that have similar spectral properties. When a 10-class classification is done, Multispec assigns each pixel to one of 10 different groups, depending on what group best represents the value of each pixel. Multispec can output the results in the form of a color coded image. The new image would have only 10 colors, with each color representing an area with similar spectral properties to other areas with that same color. Multipec can also output text results such as the percentage of area represented by each group. Figure 1 shows a Landsat 7 ETM+ false color composite (bands 4,3,2) of Durham, NH. Figure 2 illustrates a 10-class unsupervised classification of the same area, done with Multispec software. Multispec has separated the image into 10 different colors and assigned an arbitrary color to each cluster.


When the new image is produced, it needs to be compared to the original. Multispec has done the hard work by separating the types of land cover, but now you have to tell it what groups are what. If you know that just by looking at the original image, you can label that group with the appropriate name. The best way of determining the classification is to go into the field and check each type of classification. When you have determined what land cover method is represented by each cluster, you must have a method of labelling each of the land cover types. The method that we will show you is called the MUC classification system. This is a standard classification method that is used throughout the world and provides unique number values for each type of land cover. It is important to have a standard methodology so that the results can be compared to other areas.
As you can see, this can be a very valuable tool and is a much faster
method than going out in the field or using the aerial photo methods. It
is quite accurate and you can achieve higher levels of accuracy with better
resolution. Any number of classes may be used as well. Ground checking
is important and although it takes some time to go to each area, it is
much faster than having to go to each spot on the image and map it yourself.
Applications
Land cover mapping is a valuable tool that allows us to see the patterns that exist across the New England landscape. The patterns that we see are the products of many years of natural and human influences. The classification process not only separates the land cover into different classes, but also can show what percentage of the image is covered by each class. Knowing how much and what types of cover make up the landscape allows scientists to predict insect infestations, assess the amounts of different types of timber, and assess wildlife habitat. Having this data gives people the power to make decisions about what areas can be utilized in some way and which areas need to be protected. These are only a few of the many applications that land cover mapping provides and we hope that students will come up with their own ideas while having a lot of fun and learning about their environment.
We presented this activity at the Land Cover Classification workshop this past summer, as well as the spring workshops and teachers have really shown great enthusiasm. One of the questions that came up was, "What is the minimum number of classes that the classifications need to be useful." Using the Durham Landsat image, we found that a six class image was effective in delineating classes with enough accuracy. That also makes it easier for students to correctly field check the classes. Figure 3 shows a six class image of the Durham, NH subset. Figure 4 illustrates a closer view of Durham where you can easily pick out boundaries between each of the six classes. The unsupervised classification was edited to show labels and more realistic colors for each class.
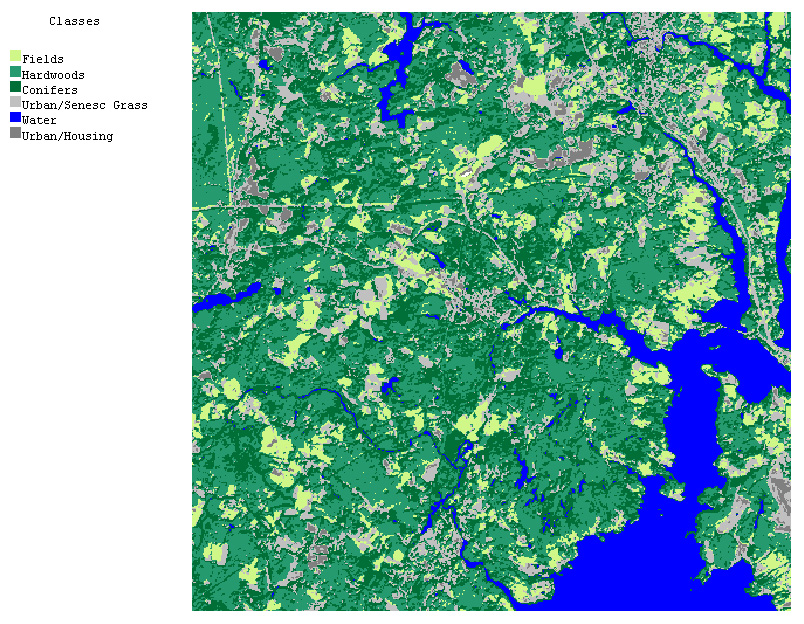
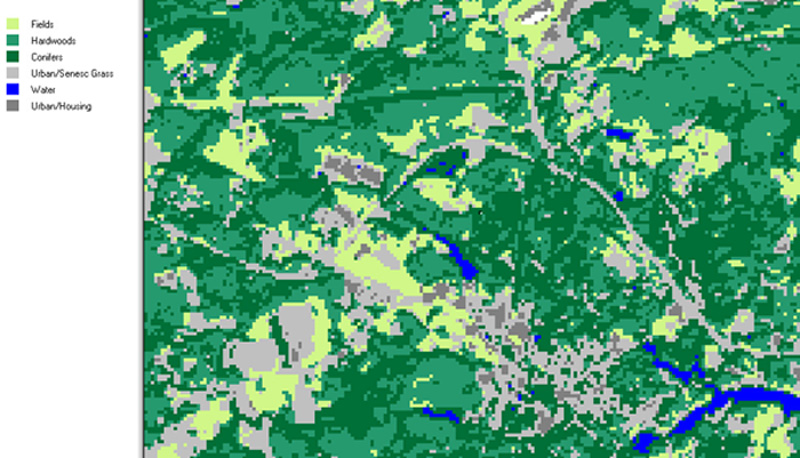
One great advantage to this classification method is that once the land cover is determined for a particular area near your school, it can be applied to the other areas of the image with the same color. In this way, it takes a small amount of checking to get an accurate assessment of the different land cover types within the larger image. It would be helpful for students to find the areas on the image where they live and determine what type of land cover is present in those areas. When that information is matched with what others have seen in that same class, it will allow a more accurate assessment of what type of cover that class represents.
The methodology is the basically the same as that used by the GLOBE program, so we urge you to check out the information that they have about the process. If you would like more information about land cover mapping, we would be glad to provide that to you. Also, if you have comments or questions about the activity please ask one of us at UNH. We would also like you to share any ideas about other types of materials, information, or activities that you would like to see.
Requirements:
Teachers or individuals who would like to participate in this part of Forest Watch will need to be trained in the procedures of classification. If you have experience in the classification process and would like to participate, we still need to go over the procedures of submitting data and let you know what products are needed. The following information gives a general guideline of the procedures and expected products from each school that participates.
Methods:
- *Perform manual classification on enlarged portion of the image (your town) using the image printout, clear acetate, markers, and a topo map of the area.
- Open Landsat image of your town in Multispec software and familiarize yourself with your area
- Perform an unsupervised classification using the GLOBE protocol for your Mac or PC.
- Change the colors and labels on the classification to reflect what you think each cluster represents (using the topo and knowledge of what the different colors represent in each band combination).
- Save the file and ".trl" file
- Visit areas on the image that correspond to each cluster on the classification and perform an accuracy assessment. The accuracy assessment may be performed multiple times until a valid class is assigned to each cluster.
- Send UNH the results.
Products:
- Unsupervised classification with at least six classes represented
- Trailer file with class information (with MUC classifications)
- Description of type of land cover present in each class (to go along with the MUC classes)
- Accuracy Assessment table showing overall accuracy, producer accuracy, and user accuracy for the classification that you submit
please feel free to contact Mike Gagnon at 603-862-4113 or email this site.