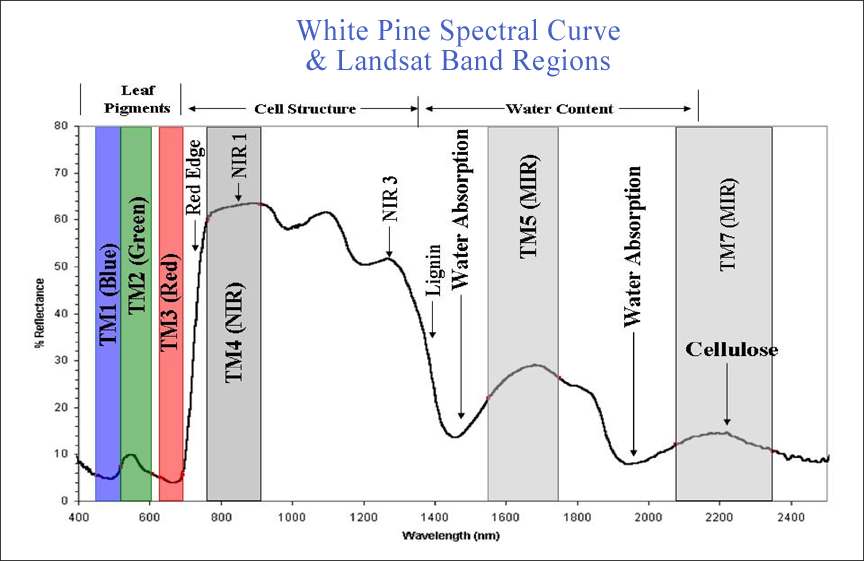
About Satellite Imagery: Spectral Curve

A spectral curve shows the location of each Thematic Mapper Landsat Image band, 1, 2, 3, 4, 5 and 7. Each band and comparisons of bands give scientists information about the health of plants as well as the identity of other features on Earth. The same light which a satellite sees reflected from Earth is what we see in the laboratory reflected from leaves or needles. This image shows the spectral curve of light reflected from some Forest Watch white pine needles.
