
About Satellite Imagery
Forest Watch invites teachers and students to experience the power of satellite imagery, views of your school from space. Thematic Mapper images taken from Landsat 5 shows us what Earth looks like from 500 miles above us.
Most of you probably use Google Earth to examine places in and around your school. What’s different about satellite imagery? Bands of light!
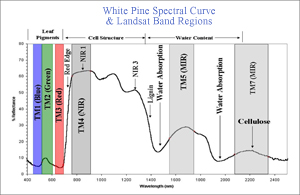
Most cameras use visible light. Landsat and other remote sensing instruments capture light reflected from Earth three bands of visible light, the blue, green and red light our eyes can see. Satellites also capture light in the infrared light spectra which our eyes cannot see, Band 4, near infrared, Band 5, and even very long wavelengths in a Band 6 and 7.
 |
|
| A spectral curve shows the location of each Thematic Mapper Landsat Image band, 1, 2, 3, 4, 5 and 7. Each band and comparisons of bands give scientists information about the health of plants as well as the identity of other features on Earth. The same light which a satellite sees reflected from Earth is what we see in the laboratory reflected from leaves or needles. This image shows the spectral curve of light reflected from some Forest Watch white pine needles. |
Landsat data in all seven bands can be viewed in software adapted to human eyes. Forest Watch uses a software developed by Purdue University, Multispec. This software delivers Landsat data in three color guns, red, blue and green. Viewers can mix and match any of the 7 Landsat bands of information. Each different combination allows us to see different Earth features more clearly.
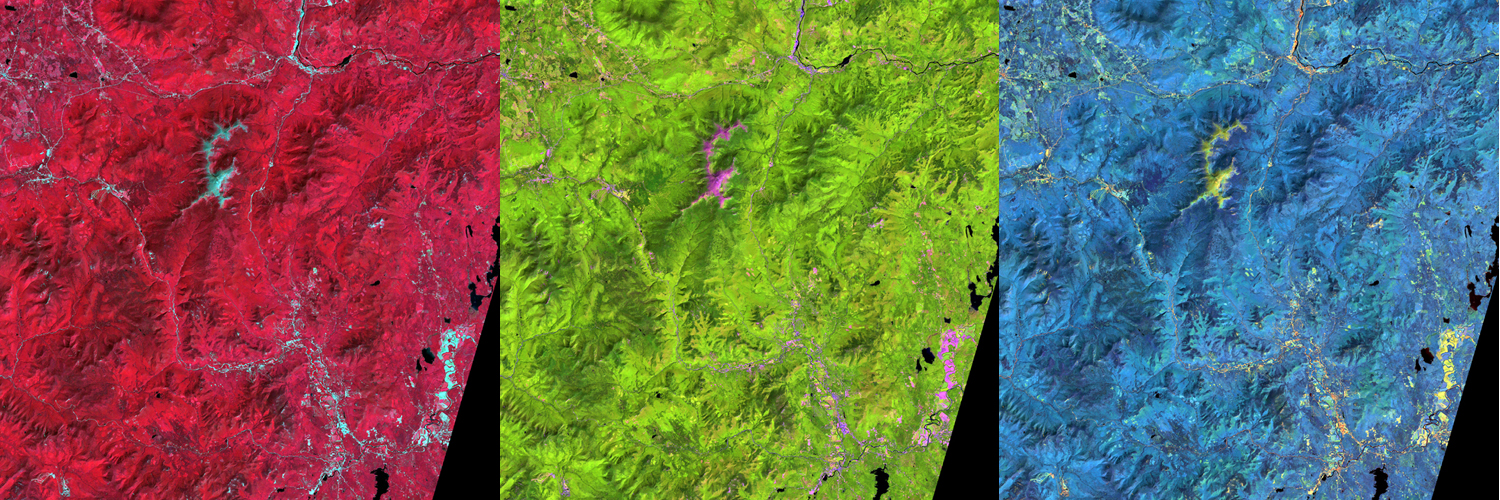
Below are three views of Mt. Washington, the tallest mountain in New Hampshire. Forest Watch schools in North Conway and Bartlett lie just south of the mountain.
 |
|---|
| Click on image for large-size view. |
Each view is different. Each gives us different information about the mountain, the forests, lakes and towns around Mt. Washington. What can you see?
The red image is a 4,3,2 selection. That means Band 4, the near infrared, a highly reflective band of light, is shown in the red color channel. Band 3, the reflected red light which is very low in trees which absorb red light, is shown in the green color channel. Band 2, the green light which plants reflect, is displayed in the blue color gun. The combination gives us a bright red picture. This combination often tells us about the difference between the near infrared high reflectance and the deep absorbance of light in the red band, an indication of lots of chlorophyll in forest tree tops.
The green image is a 5,4,3 selection. The mid-infrared band, Band 5, is displayed in the red color channel. The near infrared Band 4 is shown in the green color channel. And the red visible Band 3 is displayed in the blue channel. Which of the three bands do you think is more reflective? Did you guess “Green!” This combination allows us to compare water in plants. Can you decipher where the conifers are and where the deciduous or mixed forests are?
The blue image is a 2,5,4 selection. Green light reflected from forest canopies, captured as Band 2 by Landsat, is displayed in red! Mid-infrared light is shown in green. And near infrared is shown in blue. Again, which band is most reflective? Healthy plants generally reflect 60 to 80% of all the near infrared light which falls on them. Which are more reflective—deciduous trees or conifer trees?
We hope you enjoy these images. Forest Watch is working to develop a more interactive website for satellite image users. Soon, you will be able to select your own images and display them in any combination, right here at Forest Watch.
Until then, email us for images of your school at forestwatch.unh.edu. We can also send you images comparing one year with another year. How has your school’s landscape changed in the last decade? You might be able to figure it out with help from Landsat.
Download your own satellite images through Landsat Clic’ n Pic, under Data Links on the Measuring Vegetation Health page, mvh.sr.unh.edu/software/software.htm.
Enjoy a Power Point about The Power of Remote Sensing.