
March 2014
O3 and Forest Watch in the NewsOUR NEW 2012-2013 DATA BOOK, detailing student research on 2012 white pine needles, put Forest Watch in the newspapers.
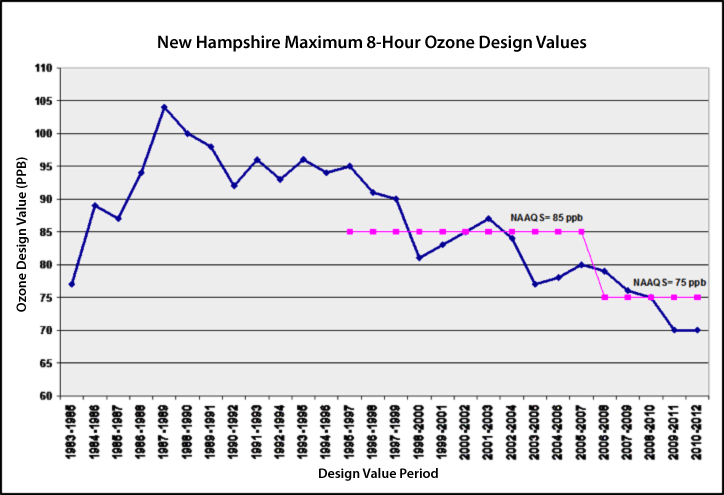
Our famous chart, below, showing an inverse relationship between ozone and white pine health was recently supported by a New Hampshire state study of ozone control efforts: sure enough, as federal standards got tougher on ozone, white pine health increased. David Sims’ fine article is reprinted here.
 |
|
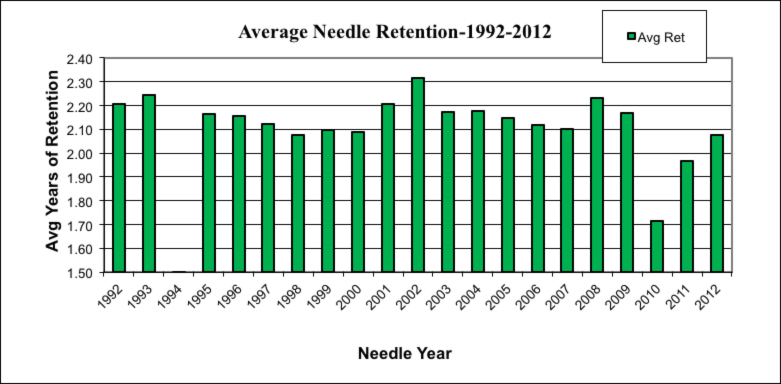
This year’s new Data Book also shows that our pines are remarkably resilient. They appear to be rebounding from whatever caused major needle cast in 2010—fungi and/or wildfire smoke. The 2012 needles show record needle length, a nice way for a tree to compensate for losing needles and chloroplasts (chart 2, below).
 |
|
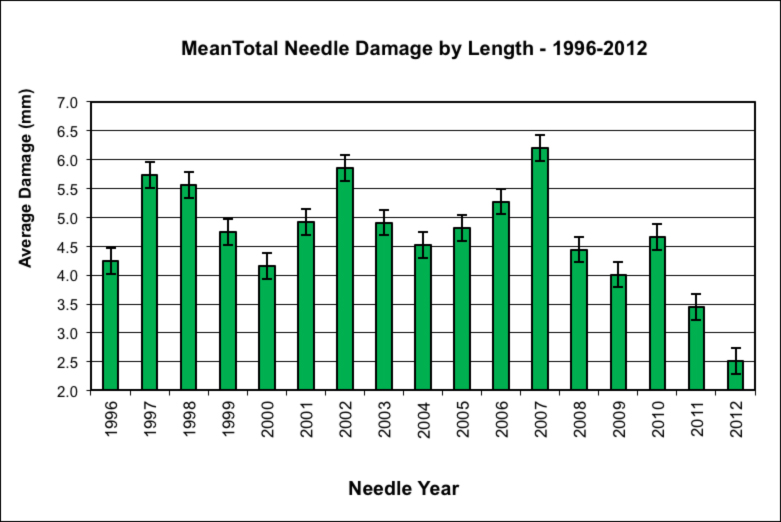
They also showed record low levels of ozone damage. (chart 3, below) And the needles once again show an average needle retention of more than two years.
 |
|
 |
|
These findings document the remarkable contributions that students and teachers can make to authentic scientific research. No one else has been tracking such information about white pine health. What is the impact of better air quality? Healthier white pines. How do the pines respond to a single stressful event? They rebound quickly because they are healthy.
The connection with New Hampshire scientist Dr. Jeff Underhill may teach us more about ozone. Dr. Underhill’s chart of falling ozone shows that ozone emissions really fell as National Air Quality Standards were tightened.
 |
|
|
|